
Obsidian Entertainment
Developer Portfolio Analytics
$150,951,529
Avg: $12,579,294
12 games
0 in last 12 months
100.0%
12 games reaching $50K net
519.4K
83.9% positive
Market Position
0.4%
Rank #52 of 2289
growing
Year-over-year performance
sparse
~503 days between releases
Revenue Distribution
Genre Focus
Top Performing Game
Grounded
Developed Games
| Price | |||||
|---|---|---|---|---|---|
 Grounded Very Positive | $40 | 88.7K | $44,738,705 | Sep 27, 2022 | |
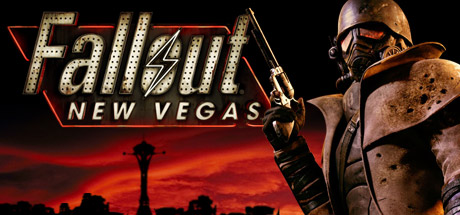 Fallout: New Vegas Overwhelmingly Positive | $10 | 231.0K | $29,108,691 | Oct 19, 2010 | |
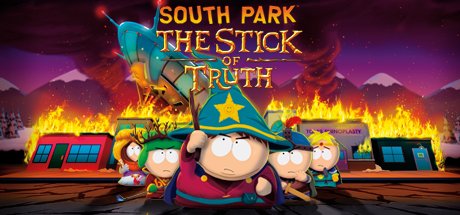 South Park™: The Stick of Truth™ Overwhelmingly Positive | $30 | 69.1K | $26,150,626 | Mar 3, 2014 | |
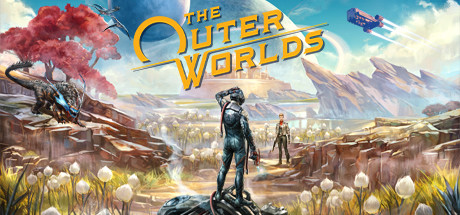 The Outer Worlds Very Positive | $30 | 26.6K | $10,045,626 | Oct 23, 2020 | |
 Pillars of Eternity II: Deadfire Very Positive | $40 | 19.2K | $9,663,528 | May 8, 2018 | |
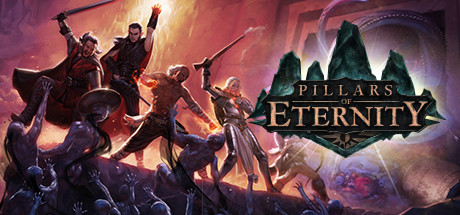 Pillars of Eternity Very Positive | $30 | 24.9K | $9,416,616 | Mar 26, 2015 | |
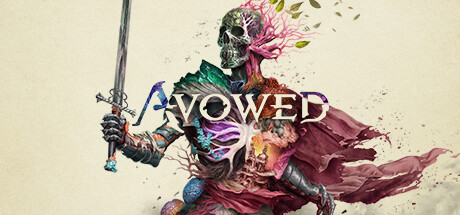 Avowed Mostly Positive | $70 | 10.6K | $9,360,402 | Feb 18, 2025 | |
 Grounded 2 Mostly Positive | $30 | 12.5K | $4,711,334 | Jul 29, 2025 | |
 The Outer Worlds: Spacer's Choice Edition Mostly Positive | $60 | 4.3K | $3,284,411 | Mar 7, 2023 | |
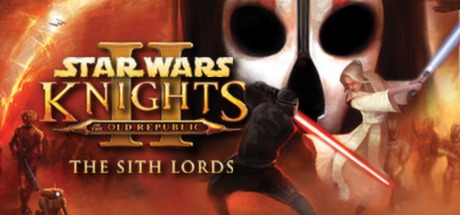 STAR WARS™ Knights of the Old Republic™ II - The Sith Lords™ Very Positive | $10 | 24.7K | $3,107,044 | Aug 23, 2012 | |
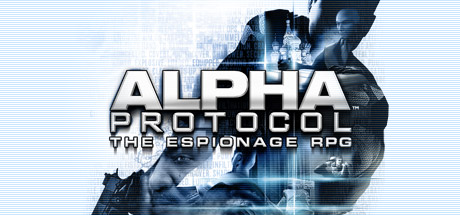 Alpha Protocol™ Very Positive | $20 | 5.0K | $1,255,037 | Jun 1, 2010 | |
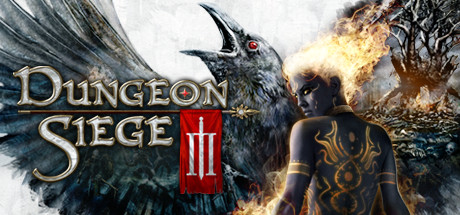 Dungeon Siege III Mixed | $3 | 2.9K | $109,511 | Jun 20, 2011 |
Tracked released premium games with known product type, USD price and at least 10 reviews. Demos, DLC, soundtracks, free-to-play and unclassified entries are excluded. Estimates are lifetime net revenue, not profit. Coverage is incomplete; memberships overlap and shares must not be added. Input dates vary by game.