
Tripwire Interactive
Publisher Portfolio Analytics
$27,637,557
Avg: $2,763,756
10 games
0 in last 12 months
100.0%
10 games reaching $50K net
329.5K
79.3% positive
Market Position
0.1%
Rank #148 of 1461
growing
Year-over-year performance
sparse
~786 days between releases
Revenue Distribution
Genre Focus
Top Performing Game
Maneater
Published Games
| Price | |||||
|---|---|---|---|---|---|
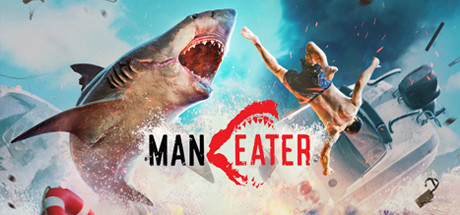 Maneater Very Positive | $40 | 19.1K | $9,627,214 | May 25, 2021 | |
 Killing Floor 3 Mixed | $40 | 15.3K | $7,726,788 | Jul 24, 2025 | |
 Killing Floor 2 Very Positive | $3 | 126.6K | $4,774,841 | Nov 18, 2016 | |
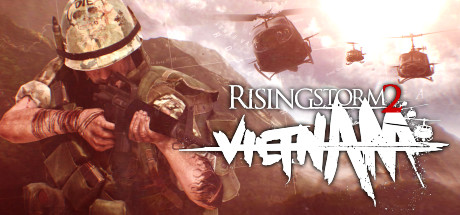 Rising Storm 2: Vietnam Very Positive | $2 | 57.6K | $1,807,753 | May 30, 2017 | |
 Killing Floor Overwhelmingly Positive | $2 | 67.5K | $1,693,549 | May 14, 2009 | |
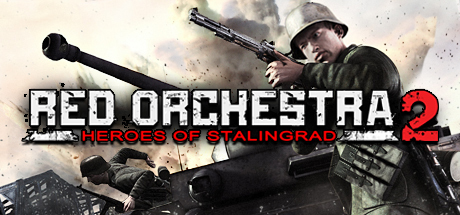 Red Orchestra 2: Heroes of Stalingrad with Rising Storm Very Positive | $3 | 37.7K | $1,421,829 | Sep 13, 2011 | |
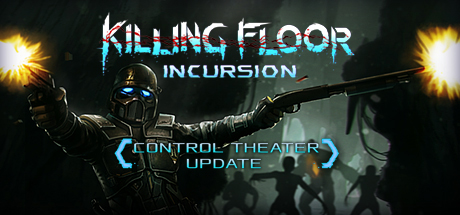 Killing Floor: Incursion Mixed | $20 | 1.0K | $258,924 | Nov 14, 2017 | |
 The Ball Mostly Positive | $10 | 1.1K | $142,123 | Oct 26, 2010 | |
 Dwarfs!? Mostly Positive | $10 | 1.1K | $133,303 | May 4, 2011 | |
 Red Orchestra: Ostfront 41-45 Very Positive | $2 | 2.5K | $51,234 | Mar 14, 2006 |
Tracked released premium games with known product type, USD price and at least 10 reviews. Demos, DLC, soundtracks, free-to-play and unclassified entries are excluded. Estimates are lifetime net revenue, not profit. Coverage is incomplete; memberships overlap and shares must not be added. Input dates vary by game.