
Deep Silver
Publisher Portfolio Analytics
$340,684,547
Avg: $17,034,227
20 games
0 in last 12 months
100.0%
20 games reaching $50K net
936.0K
78.0% positive
Market Position
1.0%
Rank #25 of 1461
growing
Year-over-year performance
moderate
~309 days between releases
Revenue Distribution
Genre Focus
Top Performing Game
Kingdom Come: Deliverance II
Published Games
| Price | |||||
|---|---|---|---|---|---|
 Kingdom Come: Deliverance II Very Positive | $60 | 112.4K | $85,039,074 | Feb 4, 2025 | |
 Kingdom Come: Deliverance Very Positive | $30 | 165.5K | $62,595,757 | Feb 13, 2018 | |
 Metro Exodus Very Positive | $30 | 123.5K | $46,712,783 | Feb 14, 2020 | |
 Metro 2033 Redux Very Positive | $20 | 116.7K | $29,427,060 | Aug 25, 2014 | |
 PAYDAY 3 Mixed | $30 | 60.7K | $22,970,778 | Sep 21, 2023 | |
 Saints Row IV: Re-Elected Very Positive | $20 | 77.3K | $19,477,779 | Aug 19, 2013 | |
 Metro: Last Light Redux Very Positive | $20 | 71.4K | $18,000,375 | Aug 25, 2014 | |
 Undisputed Mixed | $50 | 20.0K | $12,579,986 | Oct 8, 2024 | |
| Metro Exodus Very Positive | $30 | 29.5K | $11,148,946 | Feb 14, 2020 | |
 Dead Island 2 Mostly Positive | $50 | 14.9K | $9,378,404 | Apr 22, 2024 | |
 Saints Row: The Third Overwhelmingly Positive | $10 | 68.9K | $8,678,933 | Nov 14, 2011 | |
 Dead Island Definitive Edition Very Positive | $20 | 26.0K | $6,556,042 | May 31, 2016 | |
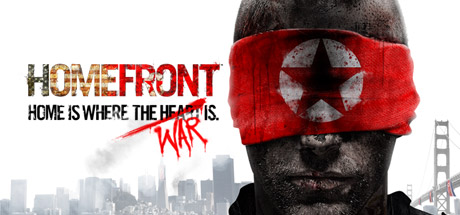 Homefront Mixed | $20 | 13.0K | $3,268,945 | Mar 14, 2011 | |
 Saints Row 2 Mostly Positive | $10 | 20.9K | $2,638,467 | Jan 7, 2009 | |
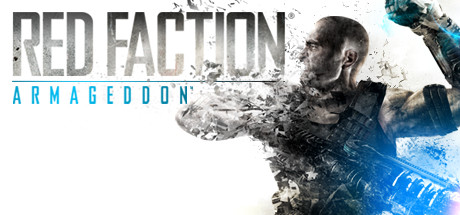 Red Faction®: Armageddon™ Mostly Positive | $20 | 4.9K | $1,240,918 | Jun 6, 2011 | |
 Red Faction Very Positive | $10 | 2.9K | $361,354 | Aug 5, 2009 | |
 Red Faction Guerrilla Re-Mars-tered Mostly Positive | $4 | 4.2K | $210,448 | Jul 3, 2018 | |
 Iron Front: Digital War Edition Mixed | $15 | 855 | $161,643 | May 25, 2012 | |
 Red Faction II Mixed | $10 | 1.2K | $155,100 | Aug 6, 2009 | |
 nail'd Very Positive | $5 | 1.3K | $81,752 | Nov 30, 2010 |
Tracked released premium games with known product type, USD price and at least 10 reviews. Demos, DLC, soundtracks, free-to-play and unclassified entries are excluded. Estimates are lifetime net revenue, not profit. Coverage is incomplete; memberships overlap and shares must not be added. Input dates vary by game.