
Ubisoft Montpellier
Developer Portfolio Analytics
$147,269,882
Avg: $24,544,980
6 games
0 in last 12 months
100.0%
6 games reaching $50K net
293.3K
82.3% positive
Market Position
0.4%
Rank #54 of 2289
declining
Year-over-year performance
sparse
~1180 days between releases
Revenue Distribution
Genre Focus
Top Performing Game
Assassin's Creed® Odyssey
Developed Games
| Price | |||||
|---|---|---|---|---|---|
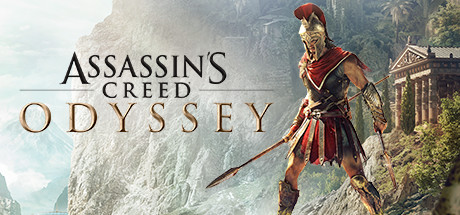 Assassin's Creed® Odyssey Very Positive | $60 | 174.7K | $132,198,096 | Oct 5, 2018 | |
 Tom Clancy's Ghost Recon® Wildlands Mostly Positive | $7 | 97.9K | $9,252,368 | Mar 6, 2017 | |
 Rayman® Legends Very Positive | $30 | 10.8K | $4,079,676 | Sep 3, 2013 | |
 Prince of Persia The Lost Crown Very Positive | $15 | 5.1K | $960,593 | Aug 8, 2024 | |
 From Dust Mixed | $15 | 2.9K | $547,695 | Aug 17, 2011 | |
 Rayman Raving Rabbids™ Very Positive | $10 | 1.8K | $231,453 | Jun 13, 2008 |
Tracked released premium games with known product type, USD price and at least 10 reviews. Demos, DLC, soundtracks, free-to-play and unclassified entries are excluded. Estimates are lifetime net revenue, not profit. Coverage is incomplete; memberships overlap and shares must not be added. Input dates vary by game.