
Topware Interactive
Publisher Portfolio Analytics
$2,663,272
Avg: $332,909
8 games
0 in last 12 months
87.5%
7 games reaching $50K net
24.7K
72.5% positive
Market Position
0.0%
Rank #486 of 1461
stable
Year-over-year performance
sparse
~396 days between releases
Revenue Distribution
Genre Focus
Top Performing Game
Enclave
Published Games
| Price | |||||
|---|---|---|---|---|---|
 Enclave Mostly Positive | $10 | 6.4K | $808,008 | Oct 4, 2013 | |
 Knights and Merchants Very Positive | $10 | 4.7K | $595,832 | Oct 14, 2013 | |
 X-Blades Mixed | $13 | 3.2K | $521,804 | Apr 30, 2009 | |
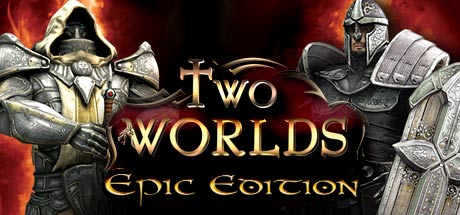 Two Worlds Epic Edition Mostly Positive | $4 | 5.6K | $319,555 | Apr 30, 2009 | |
 Jagged Alliance 2 - Wildfire Mostly Positive | $9 | 1.8K | $199,894 | Nov 16, 2012 | |
 Earth 2150 Trilogy Mostly Positive | $10 | 890 | $112,136 | Nov 1, 2013 | |
 Earth 2160 Mostly Positive | $5 | 1.4K | $88,927 | Apr 1, 2006 | |
 Two Worlds II Castle Defense Mixed | $2 | 682 | $17,117 | Jun 14, 2011 |
Tracked released premium games with known product type, USD price and at least 10 reviews. Demos, DLC, soundtracks, free-to-play and unclassified entries are excluded. Estimates are lifetime net revenue, not profit. Coverage is incomplete; memberships overlap and shares must not be added. Input dates vary by game.