
SEGA
Publisher Portfolio Analytics
$754,911,015
Avg: $13,725,655
55 games
0 in last 12 months
98.2%
54 games reaching $50K net
1.5M
86.8% positive
Market Position
2.3%
Rank #12 of 1461
declining
Year-over-year performance
frequent
~127 days between releases
Revenue Distribution
Genre Focus
Top Performing Game
Total War: WARHAMMER III
Published Games
| Price | |||||
|---|---|---|---|---|---|
 Rock of Ages Very Positive | $10 | 3.9K | $487,350 | Sep 7, 2011 | |
 Eastside Hockey Manager Very Positive | $20 | 1.3K | $339,097 | Dec 1, 2015 | |
 Company of Heroes: Opposing Fronts Very Positive | $20 | 1.2K | $290,943 | Sep 24, 2007 | |
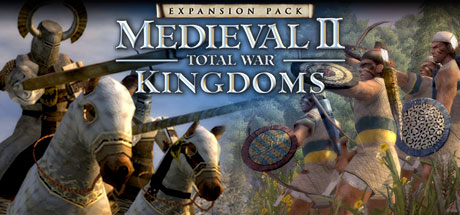 Medieval II: Total War™ Kingdoms Overwhelmingly Positive | $25 | 630 | $198,562 | Aug 28, 2007 | |
 SHOGUN: Total War™ - Collection Very Positive | $10 | 1.1K | $136,453 | Jun 25, 2015 | |
 Warhammer 40,000: Space Marine - Master Crafted Edition Mixed | $20 | 231 | $58,239 | Jun 10, 2025 | |
 The Club™ Mixed | $15 | 177 | $33,463 | Feb 20, 2008 |
Tracked released premium games with known product type, USD price and at least 10 reviews. Demos, DLC, soundtracks, free-to-play and unclassified entries are excluded. Estimates are lifetime net revenue, not profit. Coverage is incomplete; memberships overlap and shares must not be added. Input dates vary by game.