
Relic Entertainment
Publisher Portfolio Analytics
$69,557,971
Avg: $8,694,746
8 games
0 in last 12 months
100.0%
8 games reaching $50K net
246.2K
78.6% positive
Market Position
0.2%
Rank #78 of 1461
declining
Year-over-year performance
sparse
~987 days between releases
Revenue Distribution
Genre Focus
Top Performing Game
Company of Heroes 2
Published Games
| Price | |||||
|---|---|---|---|---|---|
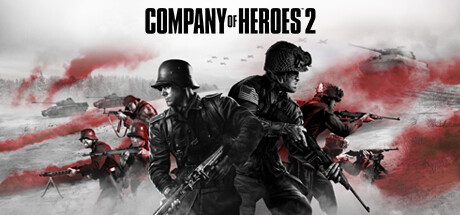 Company of Heroes 2 Mostly Positive | $20 | 110.5K | $27,865,702 | Jun 25, 2013 | |
 Company of Heroes 3 Mixed | $60 | 34.6K | $26,182,980 | Feb 23, 2023 | |
 Company of Heroes Very Positive | $20 | 17.3K | $4,360,106 | Sep 11, 2006 | |
 Warhammer 40,000: Space Marine - Anniversary Edition Very Positive | $10 | 31.0K | $3,904,972 | Sep 5, 2011 | |
 Warhammer 40,000: Dawn of War III Mixed | $8 | 22.8K | $2,293,044 | Apr 27, 2017 | |
 Warhammer 40,000: Dawn of War - Definitive Edition Mostly Positive | $27 | 5.5K | $1,877,656 | Aug 14, 2025 | |
 Warhammer 40,000: Dawn of War II - Anniversary Edition Very Positive | $10 | 13.0K | $1,638,821 | Feb 18, 2009 | |
 Warhammer 40,000: Dawn of War - Anniversary Edition Very Positive | $10 | 11.5K | $1,434,691 | Aug 7, 2007 |
Tracked released premium games with known product type, USD price and at least 10 reviews. Demos, DLC, soundtracks, free-to-play and unclassified entries are excluded. Estimates are lifetime net revenue, not profit. Coverage is incomplete; memberships overlap and shares must not be added. Input dates vary by game.