
Ubisoft
Publisher Portfolio Analytics
$695,740,082
Avg: $8,919,745
78 games
0 in last 12 months
88.5%
69 games reaching $50K net
1.9M
79.2% positive
Market Position
2.1%
Rank #14 of 1461
declining
Year-over-year performance
frequent
~90 days between releases
Revenue Distribution
Genre Focus
Top Performing Game
Far Cry® 5
Published Games
| Price | |||||
|---|---|---|---|---|---|
 Anno 1701 History Edition Very Positive | $10 | 147 | $18,521 | Apr 22, 2024 | |
 Tom Clancy's Ghost Recon® Island Thunder™ Very Positive | $5 | 164 | $10,321 | Jul 15, 2008 | |
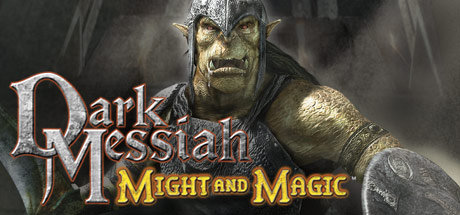 Dark Messiah of Might & Magic Very Positive | $10 | 80 | $10,080 | Oct 25, 2006 | |
 Tom Clancy's Ghost Recon® Desert Siege™ Very Positive | $5 | 159 | $10,007 | Jul 15, 2008 | |
 The Sum of All Fears Mostly Positive | $10 | 61 | $7,686 | Oct 10, 2008 | |
 Zeit² Positive | $10 | 41 | $5,166 | Jan 12, 2011 |
Tracked released premium games with known product type, USD price and at least 10 reviews. Demos, DLC, soundtracks, free-to-play and unclassified entries are excluded. Estimates are lifetime net revenue, not profit. Coverage is incomplete; memberships overlap and shares must not be added. Input dates vary by game.